Policy Activity Index
Given the enormous size of our data, we constructed a policy activity index that summarizes the different indicators in our data for each country for each day since Dec 31st 2019. The index is produced using a statistical model that takes into account which policies seem to be more costly/difficult to implement than other policies. For more details on the methodology, see our working paper. The estimation is done with Stan and is updated daily.
In the plot below you can see scores for the vast majority of countries in the world. If hover over a line in the plot, you can see the country’s policy activity score for that day.
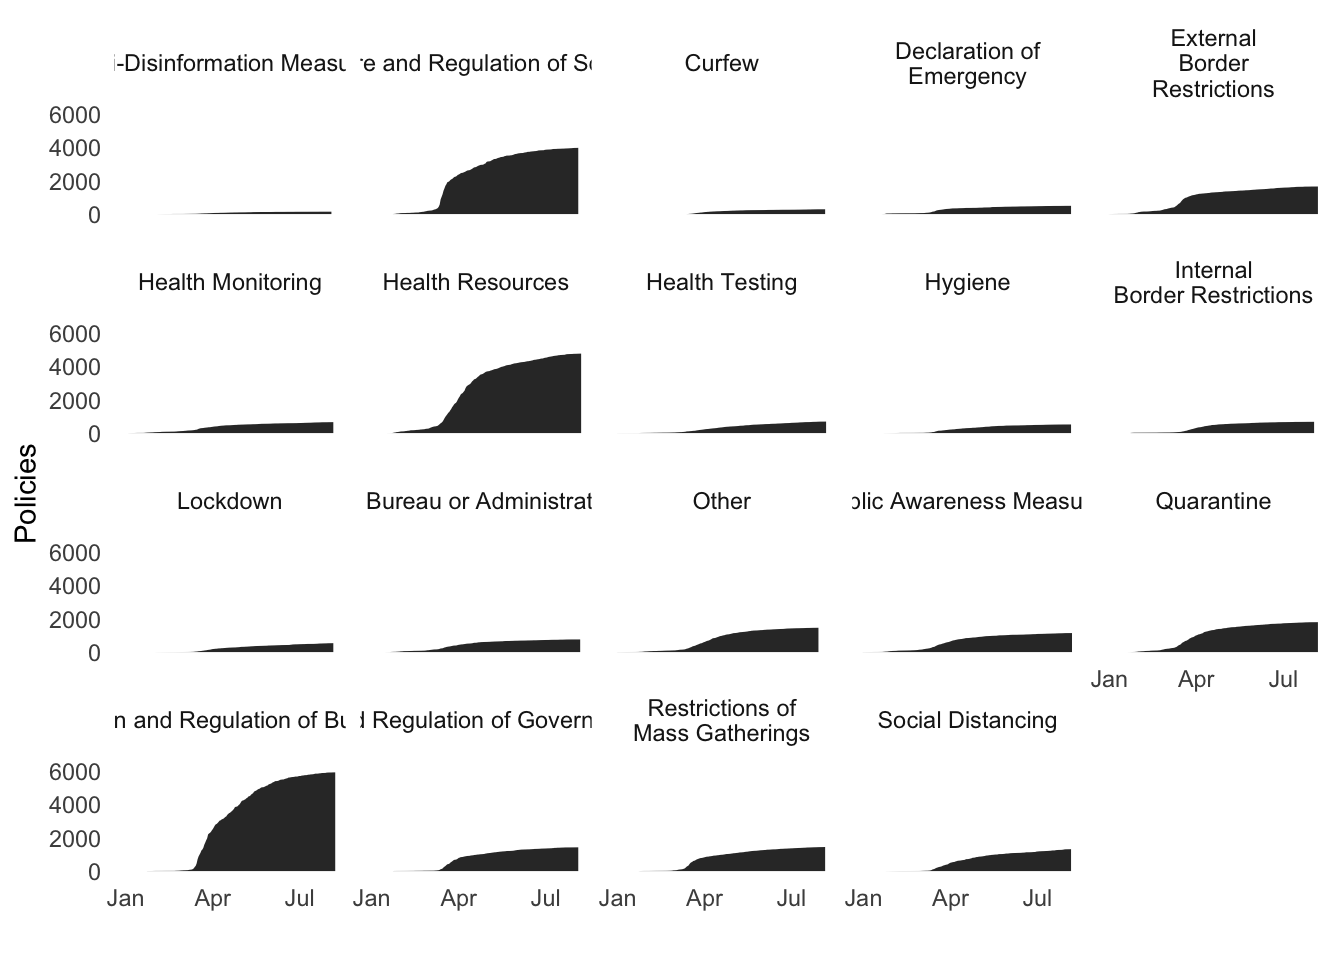
Distribution Plot: Cumulative Incidence of Policy Event Types Over Time